Introduction
Traffic itself can be a huge challenge for most commuters regardless of the transportation method of their choice. For example, it is inevitable to experience delays and congestion during rush hours. All commute methods have their own specific characteristics when it comes to delays - cars and buses suffer from traffic jams and similar principles apply to railways as well. However, the causes of railway delays are not that straightforward, and they need further investigation. According to my personal experience most passengers are not aware of the reasons behind train delays even though they are usually encountered multiple times a day. In order to have a clearer understanding, I have started to collect data from various sources at the beginning of 2019.
Traffic dataset
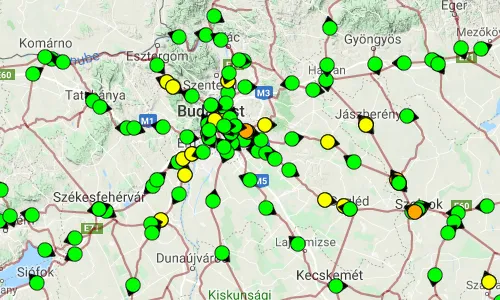
I found that the most reliable publicly available data source for traffic is the official map of Hungarian State Railways, where all trains can be tracked in real-time. The official map uses Google Maps to display the currently traveling trains. The trains are color-coded depending on their delays - green means the delay is less than or equal to 5 minutes, yellow means the delay is between 6-14 minutes, orange means the delay is between 15-59 minutes and red means the delay is above 1 hour.

A snapshot of the map contains the following information about each of the trains that were active at the time the snapshot was taken in JSON format:
| Field name | Example value | Note |
|---|---|---|
| @CreationTime | ”2020.06.25 17:41:05” | Timestamp of the snapshot |
| @ElviraID | ”5740486_200625” | Daily unique ID of a given train |
| @Menetvonal | ”MAV” | Operator of a given train |
| @Line | ”100” | Current railway line of a given train |
| @TrainNumber | ”552761” | Unique ID of a given train |
| @Relation | ”Monor - Budapest-Nyugati” | Terminals of a given train |
| @Lat | 47.48300 | Current latitude of a given train |
| @Lon | 19.12723 | Current longitude of a given train |
| @Delay | 1 | Current delay of a given train |
Weather dataset
In addition to the traffic data I also collected the corresponding weather data for every train, because I suspect that weather has an influence on the delays as well. It was not easy to find a free provider which is capable of handling the necessary amount of requests, but after many trials I decided to use OpenWeatherMap. Its free tier gives access to 60 location-based weather requests per minute, which is still not enough for every individual train, but can be sufficient to place virtual weather stations all over Hungary with a resolution of approximately 35.5 km.
NOTEVirtual weather station. A virtual weather station is a GPS position which can be queried for up-to-date local weather information.
Positions of the virtual weather stations
The first task is to distribute the available 60 slots uniformly such that every train can be assigned to the closest virtual weather station. Finding an exact solution to the problem would have been infeasible, therefore I decided to develop an approximation algorithm for which I used the GeoNames geographical database which contains POIs in Hungary and is available for download free of charge under the Creative Commons Attribution 4.0 license. The algorithm is based on a k-d tree which allows fast nearest neighbor searches for POIs. It results in an approximately uniform placement of virtual weather stations, and they are located at densely populated areas where accurate weather information benefits more people.

Extending the traffic snapshots with weather observations
Upon taking a traffic snapshot the closest virtual weather station is determined for each train and its most recent observation is assigned to the train which consists of the following:
| Field name | Example value |
|---|---|
| Weather | ”Clouds” |
| Temperature | 26.28 °C |
| Pressure | 1020 hPa |
| Cloudiness | 98% |
| Humidity | 44% |
| Wind | 1.5 m/s |
| Visibility | 10000 m |
| Rain | 0 mm |
| Snow | 0 mm |
News dataset
The official delay-related news are published on the RSS feed of MÁVINFORM, which can be processed using Natural Language Processing methods.
Summary
I am using the following system for the data collection which basically operates free of charge:

The scheduler at cron-job.org invokes a script on Heroku every minute which prepares an extended snapshot based on the real-time map, the most recent weather observations and the MÁVINFORM news. The snapshot is then uploaded to an S3-compatible storage in JSON format:
{
  "metadata": {
    "version": 3,
    "date": "2020-09-03T18:50:07.896Z"
  },
  "entries": [
    {
      "train": {
        "trainId": "552741",
        "elviraId": "5649157_200903",
        "operator": "MAV",
        "relation": "Monor - Budapest-Nyugati",
        "line": "100",
        "location": {
          "type": "Point",
          "coordinates": [
            19.29098,
            47.3969
          ]
        },
        "delay": 1
      },
      "weather": {
        "weatherType": 800,
        "temperature": 17.05,
        "pressure": 1022,
        "humidity": 0.63,
        "cloudiness": null,
        "windSpeed": 3.6,
        "visibility": 10000,
        "rain": null,
        "snow": null
      }
    },
    ...
  ],
  "posts": {
    "mavinform": [
      {
        "postId": 75931,
        "title": "Késések az észak-balatoni vonalon",
        "date": "2020. szeptember 3. csütörtök, 17.32",
        "content": "Csütörtök délután a fővárosba tartó KÉK HULLÁM sebesvonat (19703-as vonat) Fövenyes megállóhelytől 60-70 perces késéssel közlekedik tovább, mert egy utas a mozgó vonatról leszállva balesetet szenvedett. A Tapolcára tartó KÉK HULLÁM sebesvonat (19786-os vonat) Aszófőn várakozásra kényszerült, várhatóan 40-50 perces késéssel indulhat tovább.",
        "lastUpdate": "2020-09-03T15:32:48.000Z"
      },
      ...
    ]
  }
}
As of June 2020, the dataset consists of 700,000 snapshots containing over 135 million train records. In the next article I am going to evaluate the dataset and provide possible answers for the delay problem.